JUST2CE Supply Chain Explorer
The JUST2CE Supply Chain Explorer is a learning tool which aims to support users to explore supply chains, better understand their complexity on the global scale, and explore elements related to justice and circularity.
Users can select a sector and country of interest from the drop down menu to start the analysis. The tool utilises the latest international macroeconomic data to visually map the location of the major economic inputs to the chosen sector.
1. Select an economic sector
2. Select a country
3. Analyse and explore global and sectoral inputs
Shaded Countries
These represent the location of supply chain inputs for the selected sector/country where data exists.
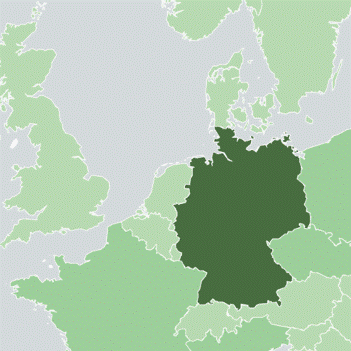
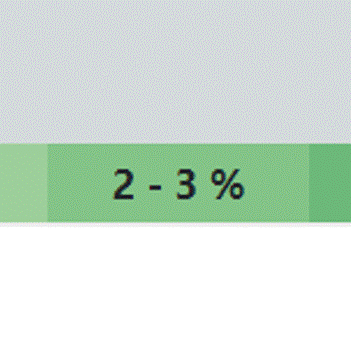
Legend & Colour Coding
Darker shading means this country contributes more inputs to the selected sector/country. The colour bar at the bottom of the map indicates correspondence with the percentage of total inputs.
Layer toggles
Layers may be toggled in the top right. These currently display the locations of a range of JUST2CE case studies.

Country Info Boxes
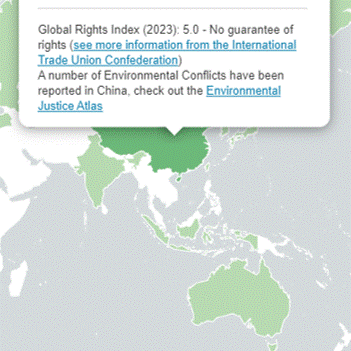
Clicking on a shaded country produces a pop-up which provides a breakdown of the sectors contributing to the selected supply chain and justice related information.
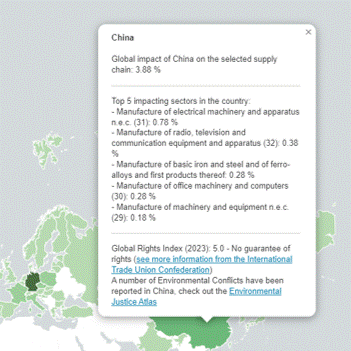
Supply Chain Contribution
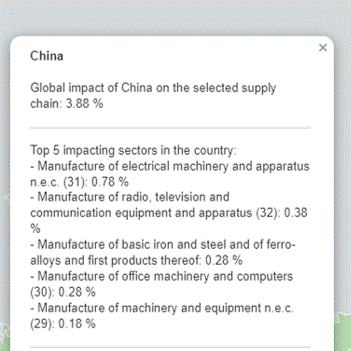
The 'contribution' indicates the total percentage of inputs the country provides to the selected industry/country. This is further broken down by indicating the top 5 contributing sectors.
A just transition
Various indicators related to the project's themes of gender, labour, and global environmental justice are displayed in the pop-up box.
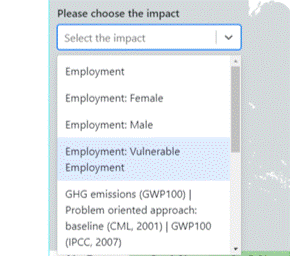
Impact Selection
The user can select and explore a number of impacts relating to the chosen supply chain by clicking the tickbox on the left hand side of the tool.
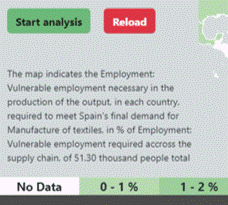
Impacts across the Supply Chain
The resultant map displays the selected impact in each country which results from the final demand of the selected supply chain. Percentages are relative to the total impact across the whole supply chan.
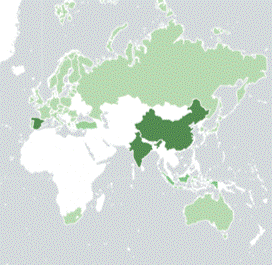
Comparing contributions
Users can compare the impact map with the default total output map to explore how impacts and the location of employment and resource extraction are uneven across the supply chain.
Tutorial
More About the Tool
Legend & Colour coding
The map is colour-coded according to the percentage of total inputs each country contributes to the chosen sector/country. For example, a figure of 4.8% for Spain means that for the production of goods or services within the chosen sector x within the chosen country y, Spain contributes 4.8% of the primary inputs for this activity (e.g. as raw materials, services, etc).
Country Pop-up Box
Once the map has been generated, the user can click on each country to reveal a pop-up box and display further details about the supply chain, as well as justice related elements. As of the most recent update of the tool, this box contains the following:
Section 1: The total contribution of inputs to the selected sector/country as a percentage of total inputs, and a break down of the top sectors within this country which contribute to the selected supply chain. Given as a percentage of total inputs to the selected sector/country.
Section 2: Environmental Justice indicators, including Ecological Footprint, and links to the EJAtlas.
Section 3: Labour related indicators.
Section 4: Gender Justice related information for the selected country.
Case-study Layers
The layer toggle in the top-right corner displays CE case studies which the user can click on to explore further details of JUST2CE’s work here.
The impact analysis feature has been added as of June 2024. This section will be updated with details soon.
Multi-Regional Input-Output Data
The foundations of the JUST2CE Supply Chain Mapper are based on multi-regional input-output (MRIO) tables.
Input-Output analysis is a macroeconomic technique used to understand the interdependencies of economic flows at national, and international scales. It is built upon tabulated information concerning the flows of products from each sector, the producer, to each of the other sectors, including itself, which are considered as consumers. At a fundamental level, Input-Output tables show how the output from one sector may become an input to another sector.
EXIOBASE 3
The initial dataset used within the development phase of the tool is EXIOBASE 3. It is expected that future development will consider alternative datasets with wider country coverage.
EXIOBASE 3 provides MRIO tables for 163 sectors per each of 44 countries (28 in Europe, plus 16 ‘major economies’), and 5 rest of the world regions, with annual datasets ranging from 1995 to 2022. The default dataset selected to be used within the current iteration of the tool is that for 2022, providing users with the most up to date information available.
How have sectors been defined?
Sectors correspond to data formatting of the 163 industries within the EXIOBASE 1 database. These roughly correspond to NACE Rev. 1 and ISIC Rev. 3 categories (both of which are now obsolete), with the addition of impact specific industries such as Recycling, and Landfill activities.
Whilst we expect to make subsequent updates to expand on displayed data, the current version of the tool contains various indicators, disaggregated at the country level.
Supply Chain Related Indicators
- Trade as a share of GDP represents the sum of the country’s exports and imports divided by GDP. This is expressed as a percentage, and can be higher than 100%. This is often the case for small countries that have a high productivity. Data is from Our World In Data, extracted from OECD and Word Bank Data.
Environmental Justice
- The Environmental Justice Atlas provides an important compendium of collated documentation on environmental conflicts. The tool displays the number of cases currently present in the Atlas for the selected country, as well as their primary typology.
- The Ecological Footprint per Capita represents a country’s total Ecological Footprint divided by its population. Footprint is designed to indicate the dependence on the planet’s ecological resources, and the extent of ‘overshoot’. The footprint network judge that our planet is only able to sustain a footprint of 1.6 global hectares per capita.
Labour
Read more about the relevance of labour to the CE transition within our Directory.
- The Global Rights Index has been compiled by the International Trade Union Confederation, and assesses labour and trade union rights at a country level. This is indicated on a scale from from 1 (the best score) to 5+ (the worst score).
Gender Justice
Read more about gender justice and the CE transition within our Directory.
- The proportion of time spent on unpaid domestic and care work is collected in a dataset provided by the World Bank. Domestic and care work includes food preparation, dishwashing, cleaning and upkeep of a dwelling, laundry, ironing, gardening, caring for pets, shopping, installation, servicing and repair of personal and household goods, childcare, and care of the sick, elderly or disabled household members, among others.
- Legal frameworks addressing gender equality overall is an indicator collated by the United Nations as part of Sustainable Development Goal 5: ‘achieve gender equality and empower all women and girls’. Data is extracted from Our World In Data. Further information about methodology may be found here.
- The Gender Wage Gap in average wages is extracted from Our World In Data, and derived from ILO datasets.
The tool’s development has been outlined across the various deliverables of JUST2CE’s Work Package 4.
- The preliminary work that led to the conception of the tool in its current iteration is described in Deliverable 4.1: Decision Support Tool Specification.
- Deliverable 4.2: Decision Support Tool Beta Version describes the construction of the beta version of the tool.
- Deliverable 4.3: A Roadmap for Testing and Adoption outlines initial plans for the dissemination and testing of the tool.
The tool has been developed by various JUST2CE partners across the project. The tool’s design was led by colleagues at The University of Sheffield, with the technical implementation performed by Energy@Work. Testing has been led by the South-East European Research Centre, and dissemination activities planned by Medwaves.
Any enquiries about the tool should be directed in the first instance to Ben Purvis at the University of Sheffield.
Feedback
The tool, alongside the Transitions Directory, is a work in progress. Any feedback would be hugely appreciated, as this will allow us to optimise the user experience, and reflect on the scope and purpose of the tool. Please consider filling in the form below.
